
Google Charts by Google
Google Charts is a web-focused charting library for teams building data visuals directly into websites and apps. It works well for lightweight interactive reporting, but teams shou...
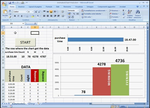
Excel Chart Animation software reviews, alternatives, pricing, & feature 2026
Excel Chart Animation is a specialized add-in for Microsoft Excel that enables users to create engaging animated charts and graphs directly within their spreadsheets. It supports a variety of chart types, including pie charts, bar graphs, and line charts, and allows for a high degree of customization. Users can insert multiple animated charts in the same worksheet, move them between sheets, and fully customize the data series, animation speed, and the specific range of rows over which the animation plays. This tool is designed to bring static data presentations to life, making it easier to visualize trends, highlight changes over time, and create more dynamic and compelli... Business analysts, educators, marketers, and anyone who regularly uses Micro...
Business analysts, educators, marketers, and anyone who regularly uses Microsoft Excel for reporting or presentations and wants to create more visually dynamic and engaging data visualizations. It is ideal for those presenting to audiences where animated data can help tell a clearer or more impactful story.
Excel Chart Animation fills a unique niche by adding a layer of dynamism to the ubiquitous Excel chart. While a specialized tool, it provides straightforward value for users who need to make their data presentations more engaging and illustrative of changes over time without leaving the Excel environment.
Ratings in this section summarize available rating data. Software reviews are shown separately when users submit reviews.
Business analysts, educators, marketers, and anyone who regularly uses Microsoft Excel for reporting or presentations and wants to create more visually dynamic and engaging data visualizations. It is ideal for those presenting to audiences where animated data can help tell a clearer or more impactful story.
These are common features buyers compare in Data Visualization Software. Product-specific availability should be confirmed with the vendor.
Control user entry and feature availability through role-based permissions and secure credentials.
A visual overview designed for monitoring real-time system or user activities.
Execute non-routine, custom database queries whenever required.
Create tailored, one-time reports to address specific information needs as they arise.
Enable seamless data exchange and integration with external software systems.
Features that enable team members to exchange files, message, and co-author projects in real-time.
Modify the software interface with corporate logos and color schemes for a branded experience.
Modify the visual arrangement and data widgets of monitoring dashboards.
Modify the data structure and visual presentation of system reports to meet specific needs.
Develop and save bespoke layouts to be reused across various documents and communications.
Design and build interactive dashboards to visualize key performance indicators and data trends.
Efficiently gathering and moving data from various outside sources into a target system.
Pricing model: Flat Rate
Pricing can change. Confirm current plans and terms with the vendor.
Compare Excel Chart Animation with other Data Visualization Software tools that buyers often evaluate.
Google Charts is a web-focused charting library for teams building data visuals directly into websites and apps. It works well for lightweight interactive reporting, but teams shou...

ActivTrak helps teams study how work apps and websites are used, which can be useful for productivity planning. Buyers should evaluate it with clear privacy rules and employee comm...

Elasticsearch helps teams search, analyze, and make sense of large data volumes in near real time. It powers everything from site search to log monitoring, but getting the most out...

An HTML5 JavaScript charting library for developers building interactive dashboards that need fast rendering with large datasets. Uses the Canvas element for performance across bro...

Screenful is a project visualization and reporting tool that connects to popular project management and development tools like Jira, Trello, and GitHub. It automatically pulls data...

SAP Analytics Cloud is a comprehensive, cloud-based enterprise analytics platform that unifies business intelligence, planning, and predictive analytics in a single solution. It em...

Infogram is a web-based data visualization tool focused on enabling users to quickly create and publish engaging charts, infographics, interactive maps, and reports. It emphasizes...

Xtensio is a collaborative platform for creating and managing dynamic, living documents. It blends the design flexibility of a website builder with the collaborative editing featur...
No software reviews have been submitted for Excel Chart Animation yet.
Write the first reviewSoftware profiles can include software facts and public catalog information.
Software reviews are submitted by users and moderated before publication.
Claimed vendors can update profile details and respond to reviews.
This profile can include catalog facts, aggregate ratings, submitted software reviews, and vendor profile updates when available.
Claim this profile to update pricing, screenshots, features, and respond to reviews.